May 12, 2020
It’s not a surprise that traffic, like many things, has been impacted by COVID-19. But by how much? Researchers in UW CEE’s STAR Lab now have an answer to that question after employing a new scoring algorithm they developed to measure fluctuations in traffic.
“We felt a strong need and thus started to develop an online tool to quantify traffic performance on our roads multiple months ago,” says professor Yinhai Wang, director of the PacTrans STAR Lab. “Our purpose was to learn from our road sensor data and predict how traffic would perform on a future day given the weather forecast and scheduled big events like a Seahawks game.”
The researchers devised a metric called the Traffic Performance Score (TPS), which they applied to the greater Seattle area freeway network, the results of which they share on their web site. A perfect score of 100% means that roadway users can travel at free-flow speed without encountering any traffic slowing or congestion.
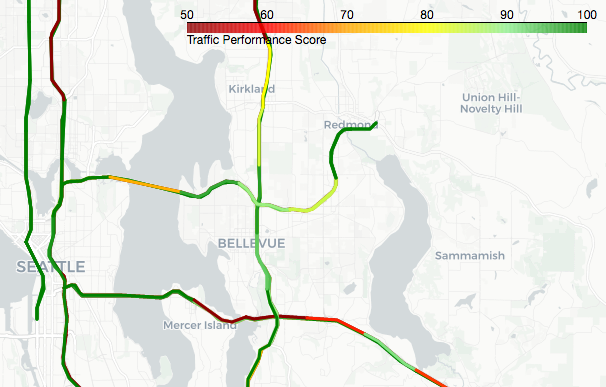
A month before tech companies asked workers to stay home, the TPS for various stretches of roadway during morning rush hour on I-5 and I-405 was as low as 27%.
“This tool can answer important questions such as how traffic performance changes during a day, impacts of COVID-19 on local traffic, traffic performance differences before and after the UW moved all courses online, vehicle miles of travel (VMT) reduction by the Stay Home, Stay Healthy order, and more,” says Wang.
According to this assessment, traffic in Seattle during peak travel times has been drastically impacted by COVID-19, with congestion improving more than 70% in some instances. For example, a month before tech companies asked workers to stay home, the TPS for various stretches of roadway during morning rush hour on I-5 and I-405 was as low as 27%. Following the stay at home order on March 23, the TPS on the same segments of roadway was 100%.
The TPS is calculated based on data collected from more than 44,000 sensors deployed by WSDOT on heavily used interstate and state route freeways including I-5, I-90, I-405, and SR-520. The TPS score takes into account three influential factors: traffic speed, traffic volume, and the length of road segments covered by sensors.
“Incorporating these factors makes the TPS a more comprehensive traffic performance metric,” says graduate student Zhiyong Cui, the lead developer on the team. “Combining multiple basic traffic flow factors, TPS can be a new type of roadway traffic performance measure.”
The researchers also calculated how the pandemic impacted the overall travel demand and network-wide TPS. The lowest observed VMT in March is approximately 64% lower than the average level in February 2020. Prior to COVID-19, the average weekday TPS during rush hour was 84%; following the governor’s “Stay Home, Stay Healthy” announcement, TPS increased to 98%. The network-wide TPS is an average of both congested and non-congested road segments in the freeway system.
“Indeed, the network-wide average weekday TPS during rush hour, 84%, is not as low as we imagined,” says Cui. “The reason is that, even during rush hour, not all the roadways segments are congested.”
In addition to assessing how traffic flow has changed due to COVID-19, the researchers hope the TPS data will inform a variety of important questions, from optimal commute times to how extreme weather or sporting events impact traffic. Designed to be scalable, the web site allows users to input specific dates and times to determine TPS scores for the entire network as well as various segments of roadway.
“We hope road users can benefit from using the web site to quickly know the overall performance of their travel routes and make an informed decision on their trips,” says Wang. “The knowledge learned from cumulative observations of this tool may also offer insights for mobility improvements.”
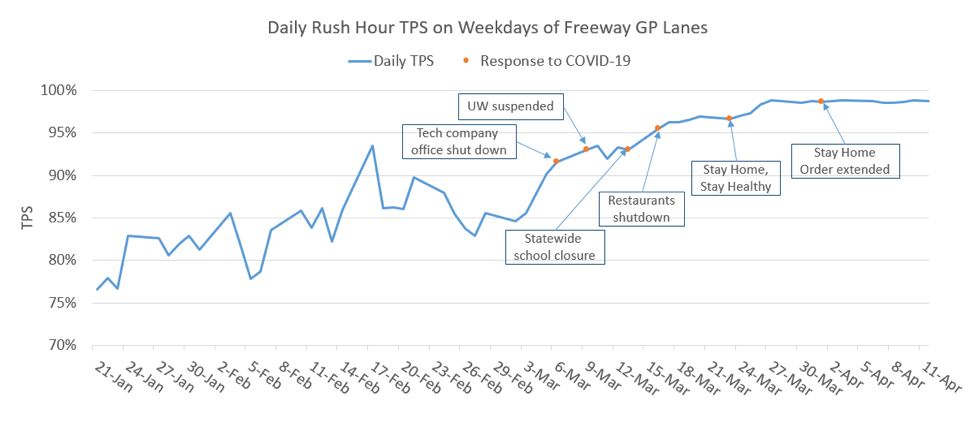
The detailed trend for the TPS for the past three months. Since Governor Inslee announced “Stay Home, Stay Healthy,” the TPS remains around 98%.