
By Julia Davis
October 19, 2026
CEE postdoc George Brencher used satellite radar to show the slope behind August's deadly landslide in Nepal was moving for weeks before it failed.
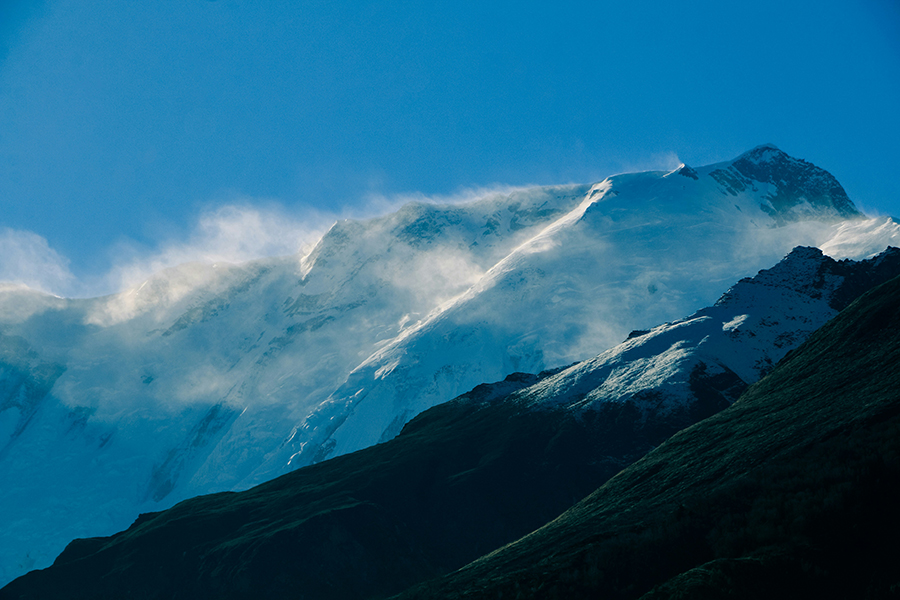
Wind blows snow off a peak in Manang, Nepal, in the Himalayas. (Neha Maheen Mahfin / Unsplash)
On August 26, part of Langtang Lirung, a mountain in Nepal near the country's border with China, broke loose, along with the glacier on its north face. The rock and ice fell about a mile and surged more than 60 miles downstream as a fast-moving flood of water, ice and debris, destroying towns and bridges. More than 1,400 people were killed and thousands more were reported missing.
At first, no one could say for sure what had happened. Many early news reports described a slab of glacier breaking off. Scientists were weighing whether ice, rock or heavy rain was to blame. George Brencher, a postdoctoral scholar in Associate Professor David Shean's lab, went looking for answers in satellite data.
Brencher uses interferometric synthetic aperture radar, or InSAR, to measure how mountain slopes move. A satellite sends microwave pulses toward the ground and records the signals that bounce back. By comparing two passes over the same spot at different times, researchers can tell whether the ground has shifted toward or away from the satellite.
"This technology can measure centimeter-scale displacement from space," Brencher says.
Using data from NISAR, a new satellite from NASA and the Indian Space Research Organisation, Brencher found that a patch of bare bedrock high on the mountain had moved more than a foot in the month before the collapse, picking up speed along the way. That pointed to a bedrock landslide rather than a glacier breaking off.
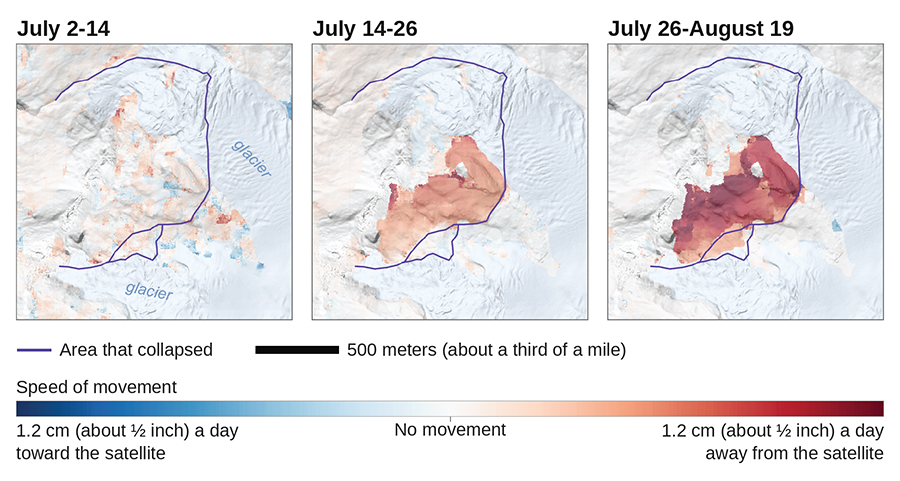
Radar data from NISAR, a new satellite from NASA and India’s space agency, show little movement on Langtang Lirung in early July, then the slope sliding faster in the weeks before it collapsed on August 26. Each panel compares two satellite passes over the same area. (Image courtesy of George Brencher)
Brencher then searched years of archived data from older radar satellites. His analysis suggests the slope had moved before, in two separate episodes. In 2018, it dropped about 10 centimeters (roughly 4 inches) and then held still for seven years. In 2025, it moved again for a stretch before abruptly stopping.
"It had been up there, moving, and no one had noticed it," he says. "This slope did not just fail out of nowhere. There was precursor motion."
InSAR often struggles in high mountains, where steep terrain and snow can block the radar signal and distort measurements, and glaciers move so quickly and chaotically that the method breaks down.
Related story
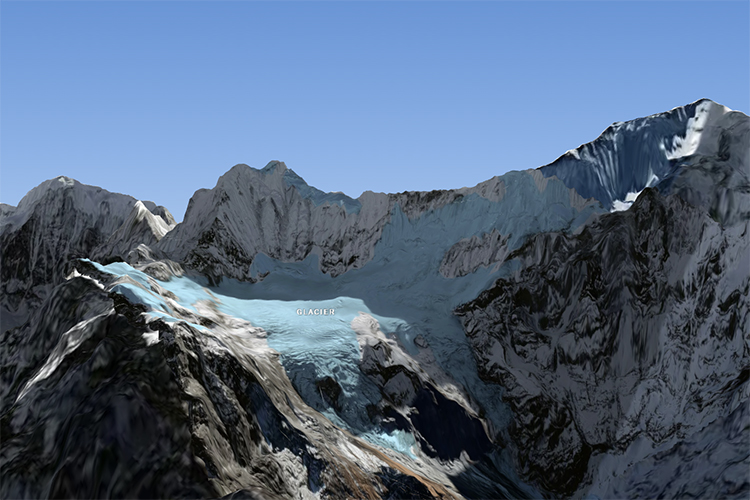
The New York Times
Tracing the cause of Nepal’s deadly flood
This visual analysis, featuring Brencher’s satellite data, shows how the collapse unfolded and how warming may have weakened the rock.
Brencher's specialty is finding the places where it does work. He is one of about 130 scientists worldwide who have been sharing results after the collapse. What triggered the failure is still an open question. The scientists are looking at the roles of snowmelt, glacier retreat and thawing permafrost.
Some people have asked why no one spotted the earlier movement and warned communities downstream. Brencher says detecting movement is not the same as predicting a collapse, since many slopes creep downhill for years without ever failing. Finding the slopes that are moving at all is hard enough.
"This is just an unbelievable needle in a haystack," he says. "It's centimeters of movement in a gigantic mountain range where many, many different things are moving."
Still, the event has motivated Brencher and his colleagues to look for other moving slopes: where they are, how fast they are moving and whether they are behaving in ways that suggest they could fail. Combined with other types of observations, that information could help provide early warning for future events, Brencher says.