
A mountain of learning

Students practice drone surveying techniques at Mount Baker

By: Brooke Fisher
Photos: Mark Stone/University of Washington
Top image: From the group’s base above the glacier, CEE Assistant Professor David Shean shows students how to launch a drone.

There’s an ideal way to learn about retreating glaciers: visit them for the day.

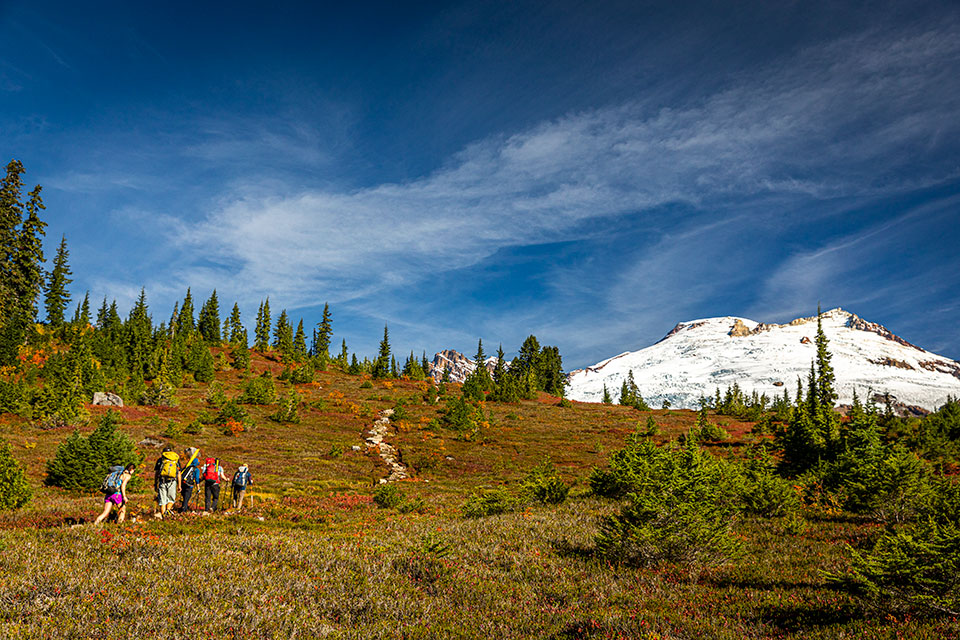
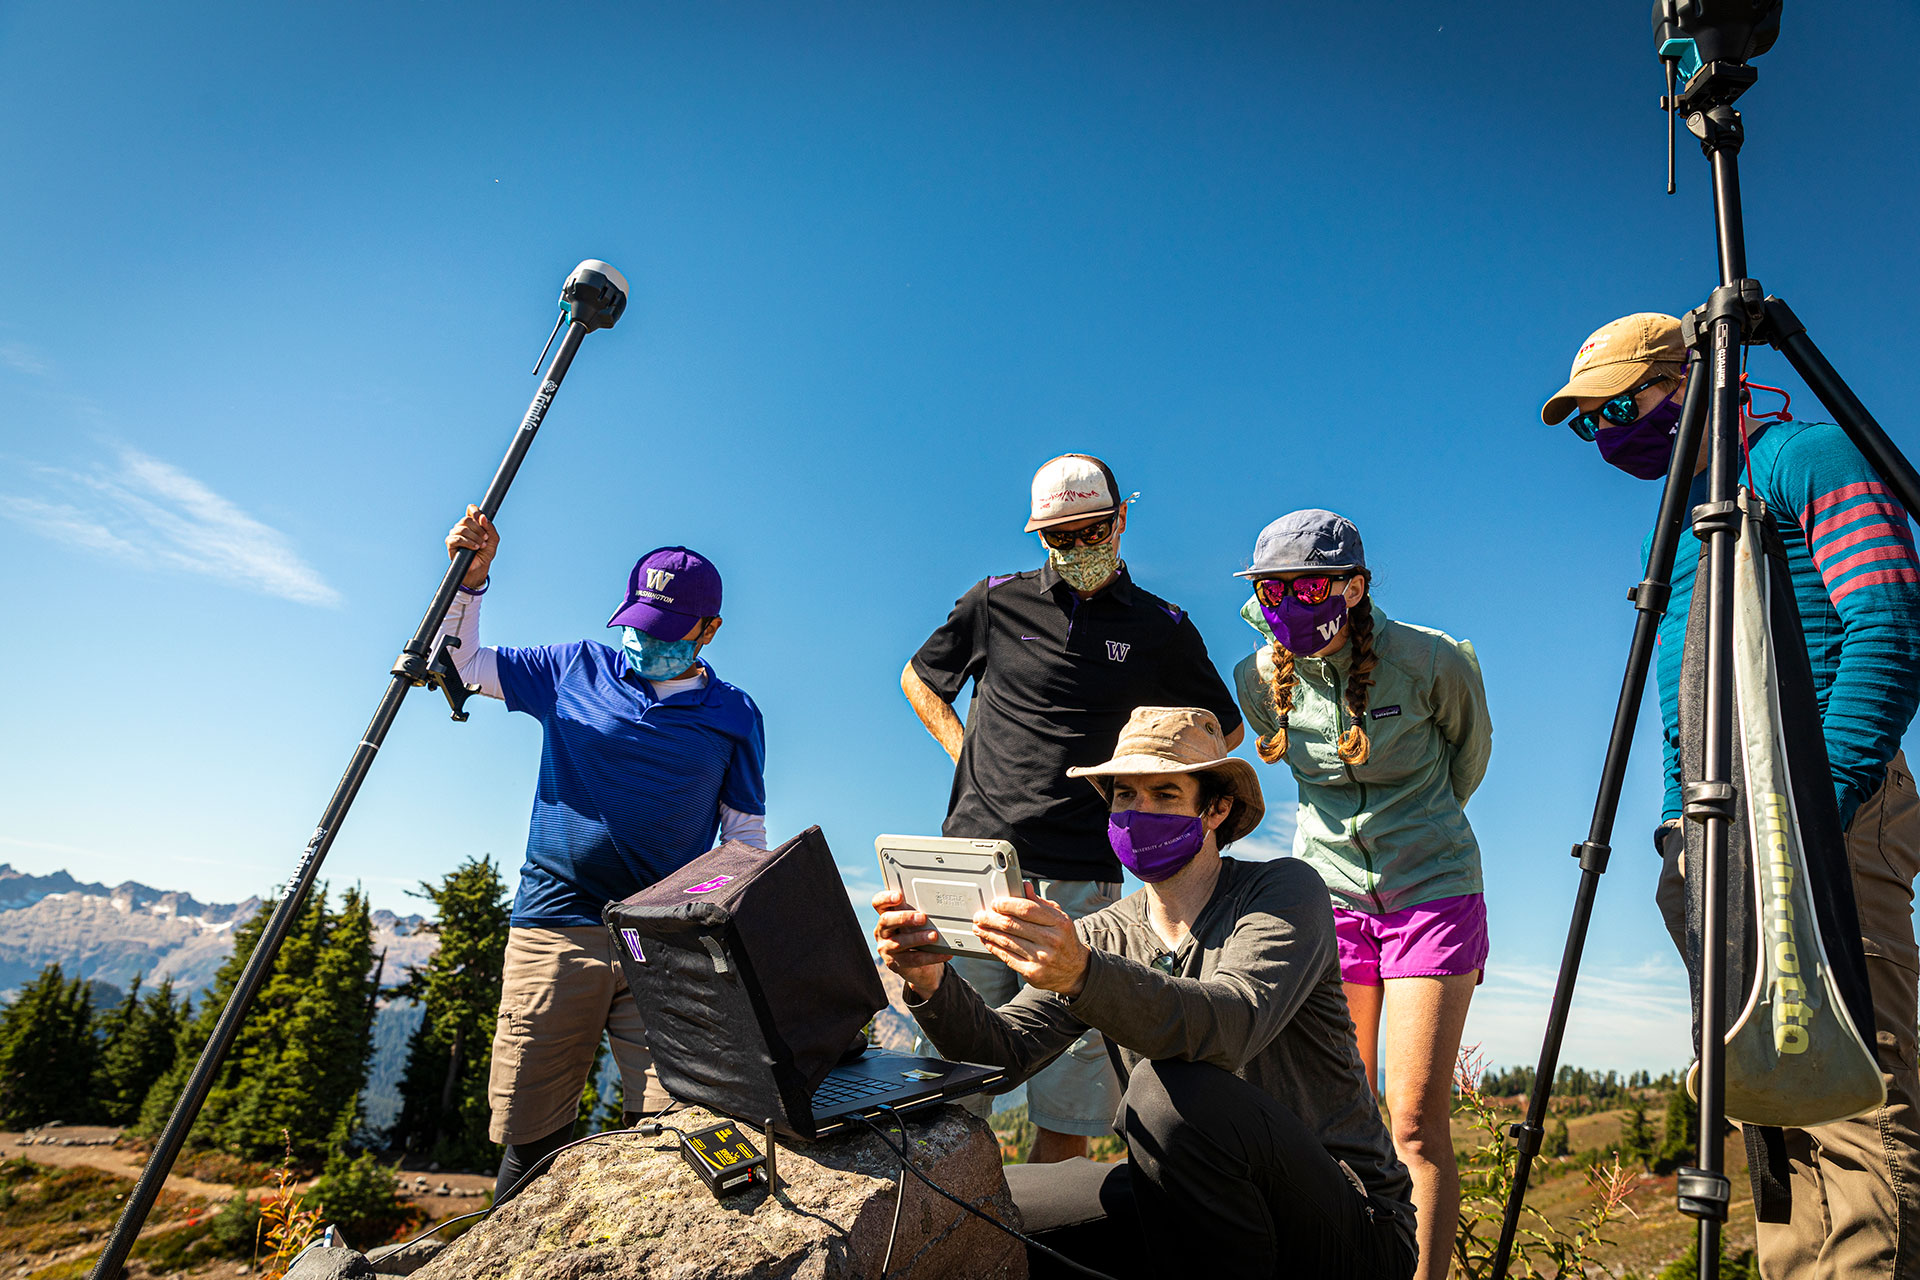
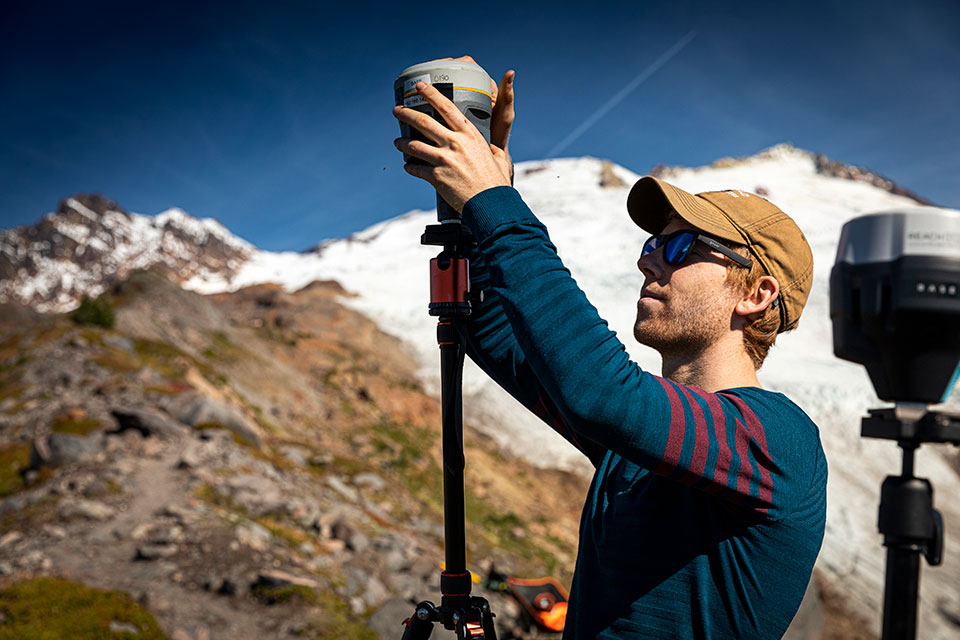
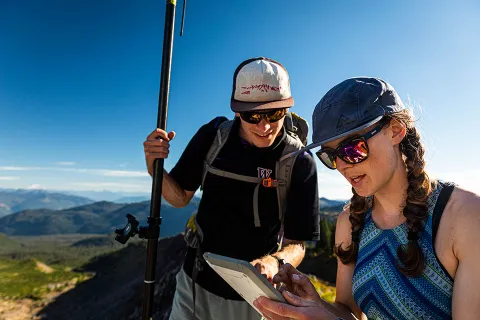
That’s exactly what a group of UW students did in September 2021, when they hiked up to one of Mount Baker’s most prominent glaciers, Easton Glacier, and learned how to gather highly precise data that can be used to track glacier change.

“It’s a great educational opportunity — students just need a pair of hiking boots,” says CEE Assistant Professor David Shean. “There are things you experience when you are standing next to a glacier that you just can’t learn in a classroom. Students feel the wind and hear the roar of the waterfall as the glacier melts. They realize there are daily variations in these things, and you don’t get that from a textbook or PowerPoint slides.”

About twice per year, Shean takes students out to the glacier. Many have already taken or are planning to take Shean’s Advanced Surveying class, which covers modern surveying techniques for scientific and engineering applications.

Students hiking up to the Easton Glacier

Hiking through blueberry meadows up to Easton Glacier

“To go through the calculations and match up the elevation models and see clearly where the glacier has thinned was interesting,” says CEE Ph.D. student Seth Vanderwilt. “Just from standing on the hiking trail, if you took a picture every year, you would struggle to put a number on how much ice has melted away.”

The outings are a mix of teaching opportunity and research for Shean, who has been studying the glacier, located in the North Cascades, since 2014. During his Ph.D. studies, Shean started using satellite data to track glaciers in Washington and continues to monitor glacial change. In the past seven years, Shean has observed hundreds of meters of retreat and up to 20 meters of thinning in places.

“It’s important to monitor sites like Easton to understand the impacts of regional climate change, but coupled with that are changes in the snowpack, vegetation and surrounding landscape, such as bedrock that was covered with ice for thousands of years,” Shean says. “We are building a record that can be used to study this interconnected system in detail.”

Gathering glacier data

After crossing glacial streams and hiking three miles through an old-growth forest, an alpine meadow and up a 180-foot tall moraine ridge created by the shifting glacier, the group set up their home base directly above the glacier. They surveyed the lower part, called the terminus, as well as the rocky area below the glacier. For many of the students, this was the first time they’d used drones to conduct an outdoor field survey.

“Since I’d never flown drones before, doing this fieldwork gave me more confidence and background,” says CEE Ph.D. student Hannah Besso. “Talking about techniques is great, but actually going out and doing it yourself helps the most.”

Left: CEE Assistant Professor David Shean explains how to perform a Global Navigation Satellite System survey, where receivers on board the drones communicated with multiple satellite networks, including the well-known Global Positioning System, to pinpoint the precise location where images were captured. Top right: Shean holds a fixed-wing drone, which can map large areas in a back-and-forth “lawnmower” pattern. Bottom right: Ph.D. student Danny Hogan sets up a Global Navigation Satellite System receiver.

A few students ventured into the valley below to place ground control point targets that would help lock in the precise locations of the drones and surface of the glacier, while other students helped launch the two drones: a quadcopter and a small fixed-wing drone with a 3-foot wingspan, for mapping larger areas. Equipped with high-resolution cameras, the drones captured a variety of photos from different locations and angles.

The students also gained valuable experience with satellite navigation and positioning, which would be important for their later modeling efforts. Survey-grade Global Navigation Satellite System receivers on board the drones communicated with multiple satellite networks to pinpoint the precise location where images were captured. 

“Even with the best-available satellite images, the resolution and geolocation accuracy of our measurements is around a few feet. Using the drones, we can get down to a few centimeters, which enables all sorts of new science questions to be answered,” Shean says. “We can measure subtle changes as well as capture the rate of change, which shows how the glaciers are evolving over time.”

On the left is a shaded relief map, which shows the topography in detail. On the right is a color orthomosaic that depicts a geometrically accurate view of the landscape

Created by CEE Ph.D. student Seth Vanderwilt, the above animations show the change in surface elevation of the Easton Glacier from 2014-2021. The visualizations were created utilizing a technique called Structure from Motion, which creates 3D reconstructions from overlapping two-dimensional images. On the left is a shaded relief map, which shows the topography in detail. On the right is a color orthomosaic that depicts a geometrically accurate view of the landscape.

Creating 3D models

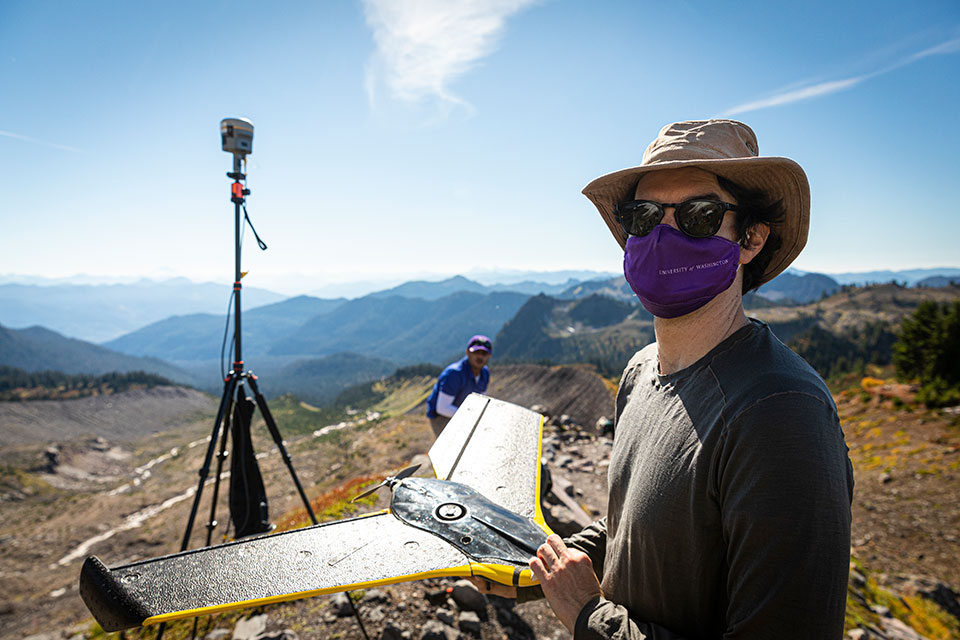
Gathering highly precise data is just the first step. In Shean’s Advanced Surveying course, students learn to use software to stitch the drone images together and create 3D models and topographic maps. 

Image
CEE Ph.D. students Seth Vanderwilt and Hannah Besso looking down at a surveying device
CEE Ph.D. students Seth Vanderwilt and Hannah Besso discuss the results of the Global Navigation Satellite System survey. 

For the final class deliverable, students apply what they’ve learned to a project of their choice. Teaming up with classmates, Vanderwilt processed the images gathered at Easton Glacier in September, along with all of the data going back to 2014. The students created a time series analysis with a combined 6,500 drone images, which revealed approximately 3-4 meters of thinning over the lower glacier each year.

For Besso’s final project, she worked with classmates to collect new drone imagery at the site of the 2014 Oso landslide, which they used to create data visualizations. Comparing their 3D models to post-landslide data gathered by the United States Geological Survey, the students found that in the aftermath of the landslide, the banks of the North Fork of the Stillaguamish River were eroding and the channel was widening. 

“We took the project from the idea phase to going out to the field site to fly drones on a weekend,” Besso says. “It was something that was within our ability level after taking the class, but it took some training and planning because there were tall trees and challenging terrain and we didn’t want to crash the drones.”

Sought-after skillset

Hands-on experience gathering, processing and analyzing high-resolution topographic data gives students an advantage when applying for jobs, says Shean. Environmental consulting firms now rely on drones for inspections and mapping, but drone surveying is not taught in traditional college courses.

“It gives our students a leg up,” Shean says. “They understand the data acquisition, software and how to deliver a final product. I get emails from students who took this class in previous years saying they did a drone survey at their new job and it worked beautifully. It’s one of the most rewarding aspects of teaching courses like this at UW.”

Related story


Peering into snow

To better measure glaciers and their seasonal snowpack, assistant professor David Shean partners with A&A researchers to outfit a drone with Ground Penetrating Radar.